Version: 5.2
2 2D Plot Procedures
By default, plot produces a Racket value that is displayed as an image and can be manipulated like any other value.
For example, they may be put in lists:
|
(list  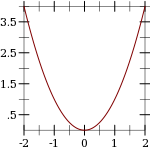 ) ) |
When the parameter plot-new-window? is #t, plot opens a new window to display the plot and returns (void).
When #:out-file is given, plot writes the plot to a file using plot-file as well as returning an image-snip% or opening a new window.
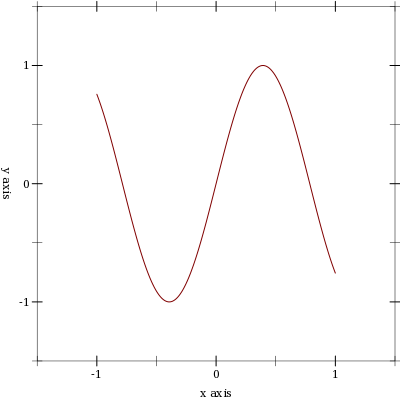
When given, the x-min, x-max, y-min and y-max arguments determine the bounds of the plot, but not the bounds of the renderers. For example,
| > (plot (function (λ (x) (sin (* 4 x))) -1 1) | | #:x-min -1.5 #:x-max 1.5 #:y-min -1.5 #:y-max 1.5) |
|
|
Here, the renderer draws in [-1,1] × [-1,1], but the plot area is [-1.5,1.5] × [-1.5,1.5].
Deprecated keywords. The #:fgcolor and #:bgcolor keyword arguments are currently supported for backward compatibility, but may not be in the future.
Please set the plot-foreground and plot-background parameters instead of using these keyword arguments.
The #:lncolor keyword argument is also accepted for backward compatibility but deprecated. It does nothing.
Plot to different backends. Each of these procedures has the same keyword arguments as
plot, except for deprecated keywords.
Use plot-file to save a plot to a file.
When creating a JPEG file, the parameter plot-jpeg-quality determines its quality.
When creating a PostScript or PDF file, the parameter plot-ps/pdf-interactive? determines whether the user is given a dialog for setting printing parameters.
(See post-script-dc% and pdf-dc%.)
When kind is 'auto, plot-file tries to determine the kind of file to write from the file name extension.
creates a slide containing a 2D plot of a parabola.
Use plot-bitmap to create a bitmap%.
Use plot-frame to create a frame% regardless of the value of plot-new-window?. The frame is initially hidden.
Use plot-snip to create an image-snip% regardless of the value of plot-new-window?.
Plots to an arbitrary device context, in the rectangle with width width, height height, and upper-left corner x,y.
Every 2D Plot Procedures procedure is defined in terms of plot/dc.
Use this if you need to continually update a plot on a canvas%, or to create other plot-like functions with different backends.